We have spent two years arguing about whether AI will replace engineers. That is the wrong question. It assumes the job of an engineering organization is to type code. It isn't. The job is to ship working systems, keep them stable, and make sure they solve the actual business problem.
When output stops being the constraint, the org chart does not shrink, it shifts.
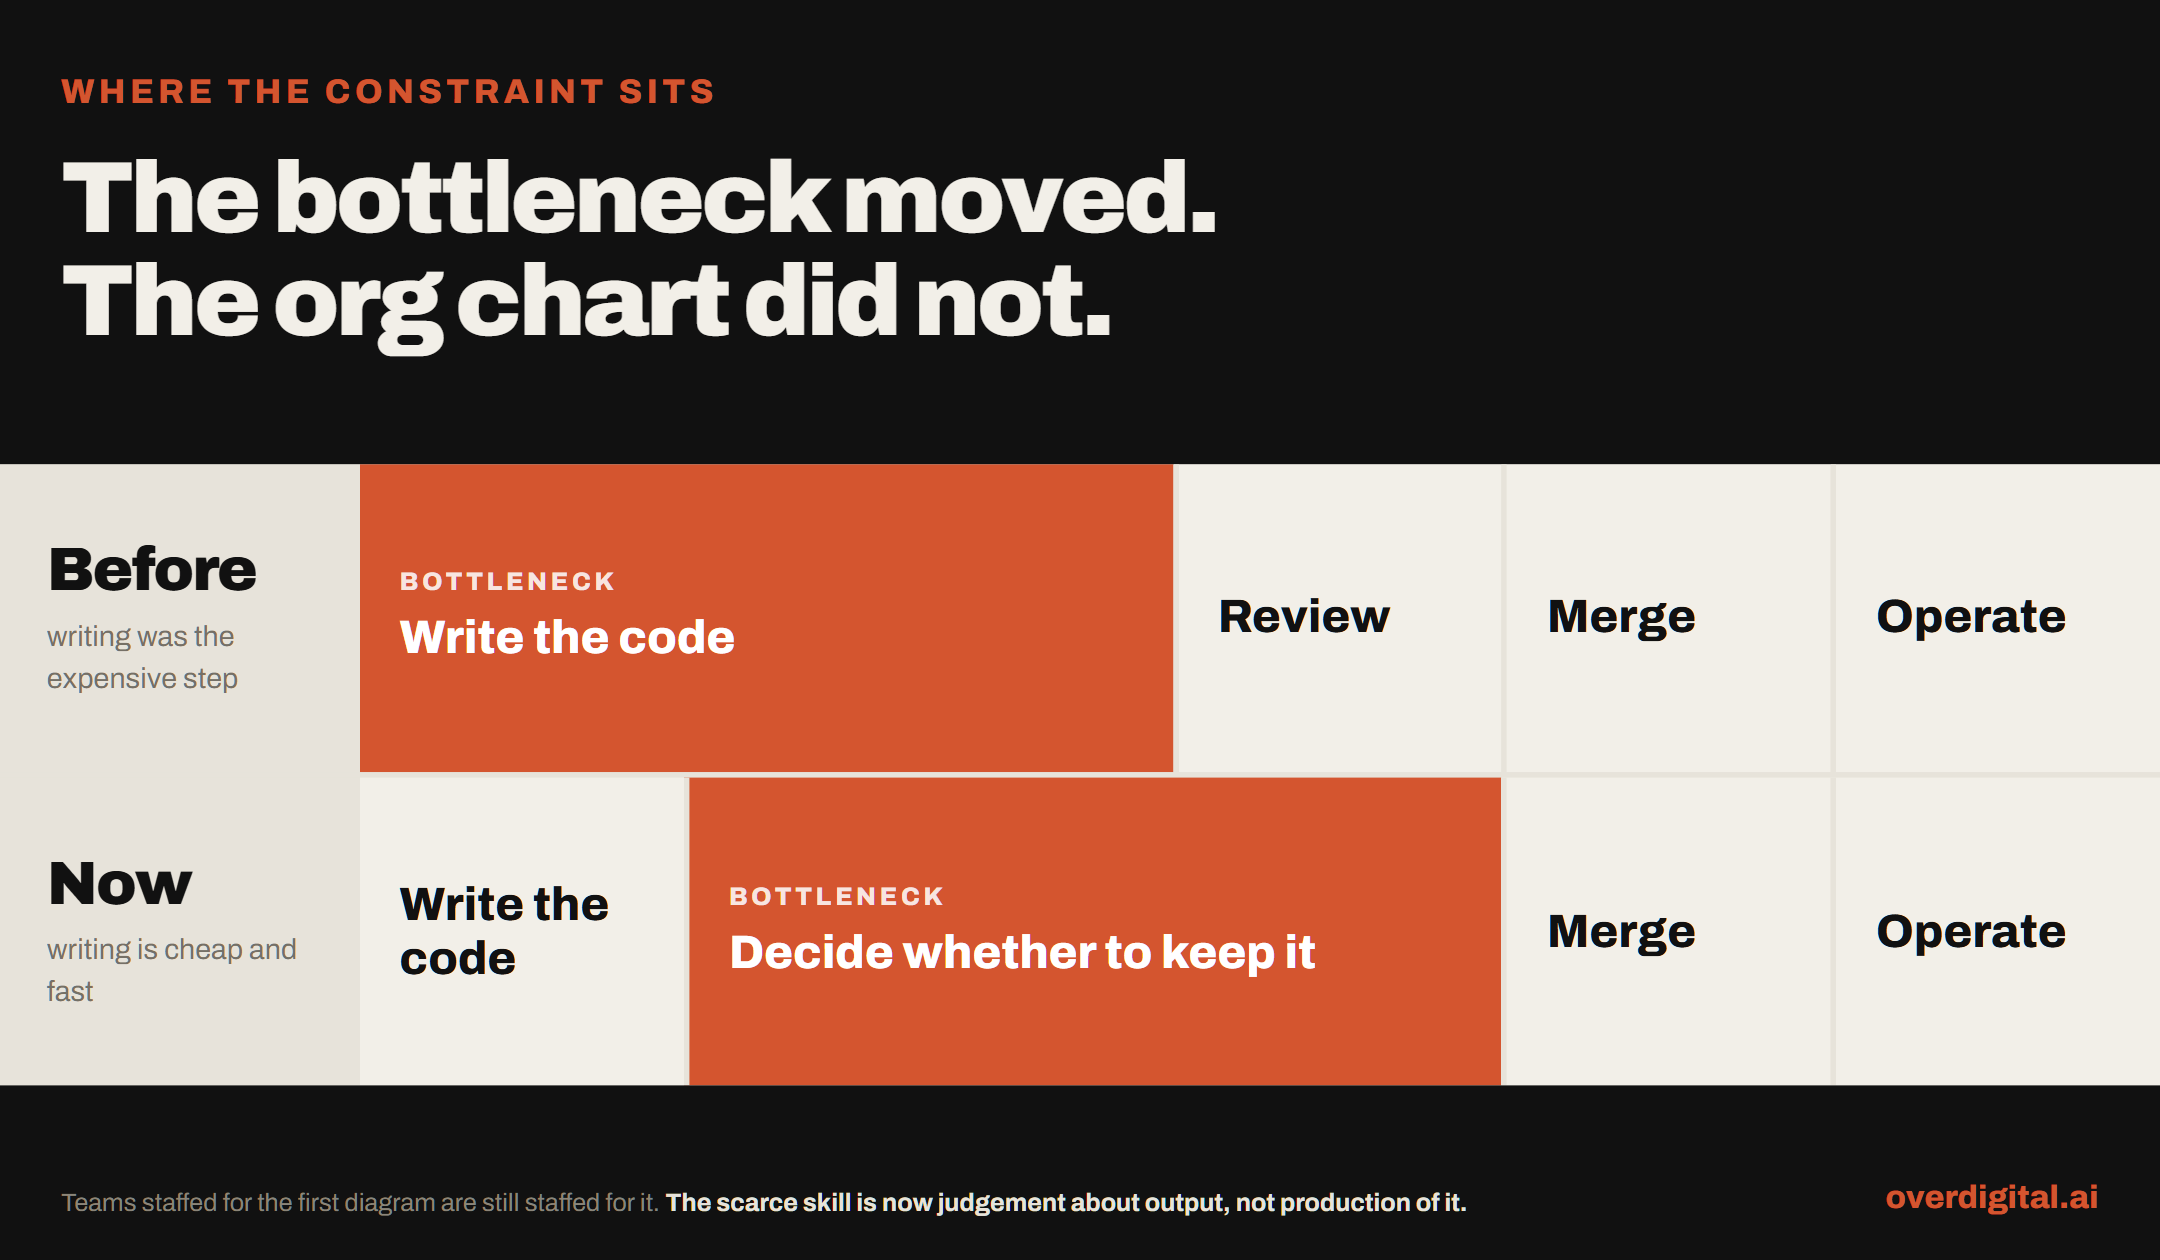
Replace individual contributors with agents and the volume of code explodes. What breaks is not the codebase, but the review process. The bottleneck moves. We are optimizing the cheapest part of the software development lifecycle while leaving the most expensive part understaffed.
Back in the autocomplete era of 2024, the data told a specific story. We thought we had a productivity illusion. Developers felt faster, but early studies showed throughput and stability both falling. Uplevel found developers using Copilot were introducing 41 percent more bugs without merging code any faster.
That era is over, and it is worth being precise about what ended it. The thing that changed is not that the code got better. It is that the unit of work you can hand over got bigger. METR measures this as a time horizon: the amount of serial human labor a model can replace at a 50 percent success rate. Their published progression across about a year runs Claude Sonnet 3.7 at 60 minutes, Claude Opus 4 at 101, and Claude Opus 4.5 at 320. Then Opus 4.6 at roughly 14.5 hours, and an early Claude Mythos Preview at 16 hours or more, which METR describes as the upper end of what they can measure without writing new tasks.
Read those last two the way METR reads them. The Opus 4.6 interval runs from 6 hours to 98. The Mythos interval runs from 8.5 to 55. METR's own note on the metric says the error bars have always been about a factor of two in each direction and are worse now that the suite is saturating, that a 50 percent time horizon of X hours does not mean you can hand an X-hour task to a model, and that what they stand behind is the slope rather than any individual measurement.
The slope is the part that matters here, and the saturation is the part almost nobody quotes. In roughly a year the frontier went from tasks the length of a coffee break to tasks that exhaust the benchmark. The ruler ran out before the trend did.
It is worth being equally clear about what has not been measured. Claude Fable 5 and Mythos 5 shipped in June, Opus 5 in July, and METR has published no time horizon for any of them, having not had the access to run the suite. Estimates circulate, some of them very large, and they are extrapolations from other benchmarks rather than measurements. So the honest position at the end of July 2026 is that the three models most likely to be writing your code have never been measured on this axis at all, and the last thing anyone did measure came back as "at least sixteen hours, and that is the ceiling of our instrument." The apparatus broke before the capability did, which is its own kind of finding.
That is the whole argument, and it does not depend on any single one of those numbers being right. A five-minute delegation reviews itself, because reading the diff costs less than writing it did. A delegation measured in workdays inverts that. Work arrives faster than a person can form an opinion about it, and it arrives in units too large to skim. Everything downstream of the merge button was sized for the first case.
The DORA 2025 State of AI-assisted Software Development report, published in September 2025, surveyed 5,000 respondents where 90 percent use AI daily. Their finding is a total reversal on throughput. Higher AI adoption is associated with an increase in both software delivery throughput and software delivery instability.
DORA is careful to report association rather than causation, and the confounds are real: stronger teams may simply adopt differently. What the report does claim is that AI acts as an amplifier of whatever an organization already does well or badly. If you have a rigorous CI/CD pipeline, high test coverage, and a culture of strict code review, AI will help you ship faster with fewer escapes. If your test suite is flaky, your deployment process is manual, and your architecture is a ball of mud, AI will help you generate technical debt at a scale you have never seen before. The speed is real, but the speed applies to everything you do, including the mistakes.
Generation got cheaper. Accepting bad output did not.
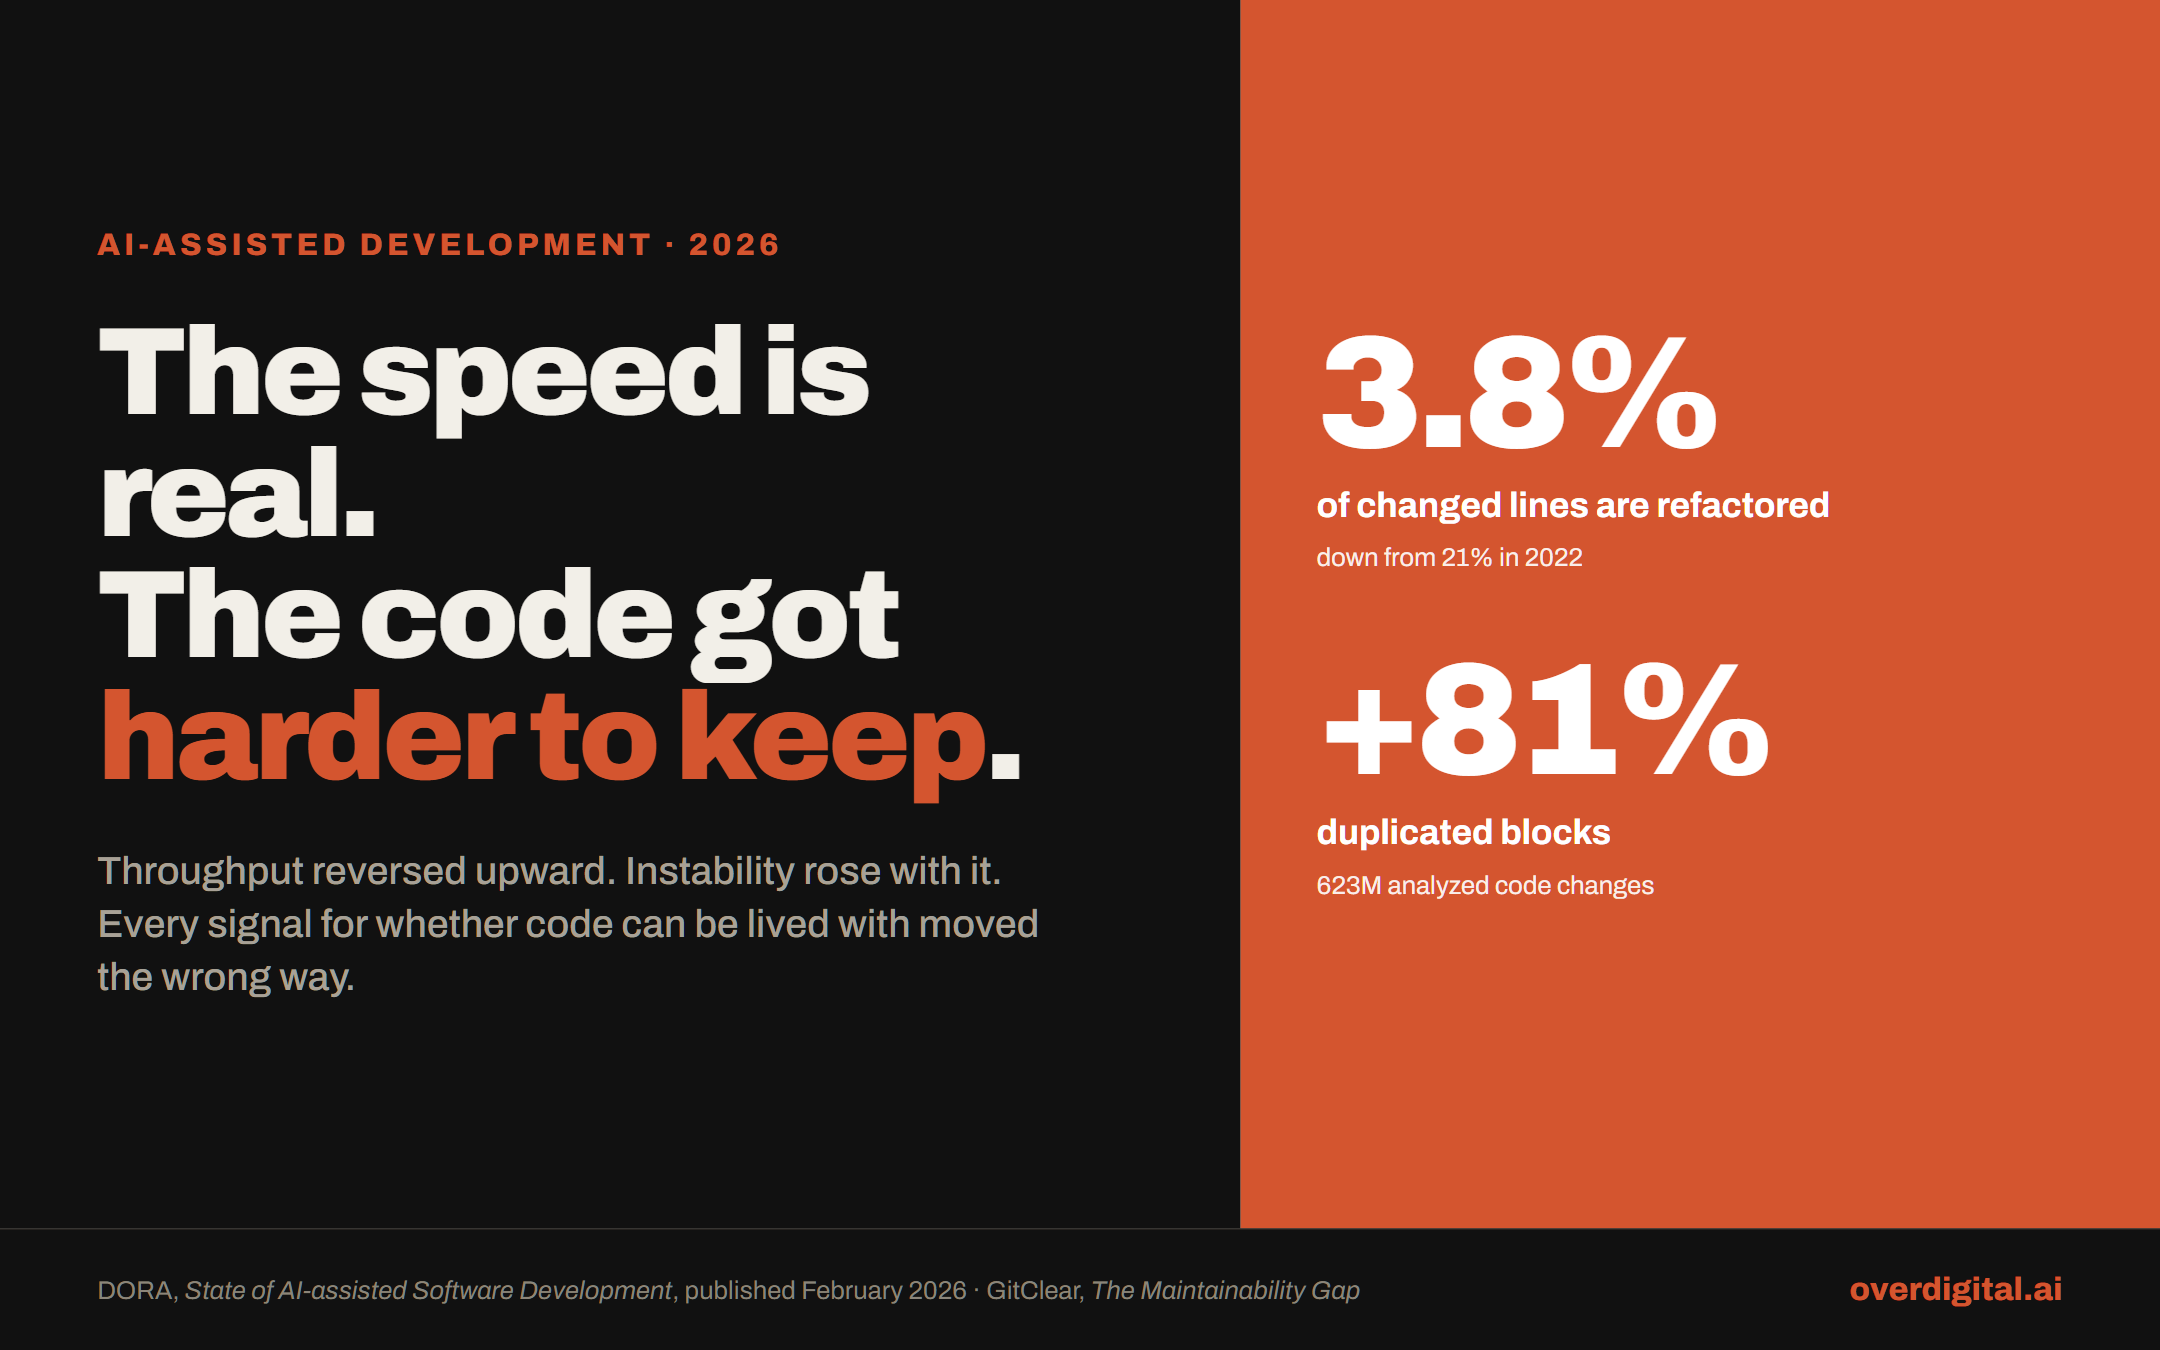
When you remove the friction of writing code, you remove the natural rate limit on architectural decay. GitClear's 2026 research, "The Maintainability Gap", analyzed 623 million code changes between 2023 and 2026. The numbers describe a structural collapse in how code is written, and they explain exactly where the cost went.
Block duplication is up 81 percent, jumping from 40.3 in 2023 to 73.0 so far in 2026. Refactored or moved code has collapsed to 3.8 percent of all changes, down from 21 percent in 2022. Copy-pasted code grew from 9.4 percent to 15.7 percent.
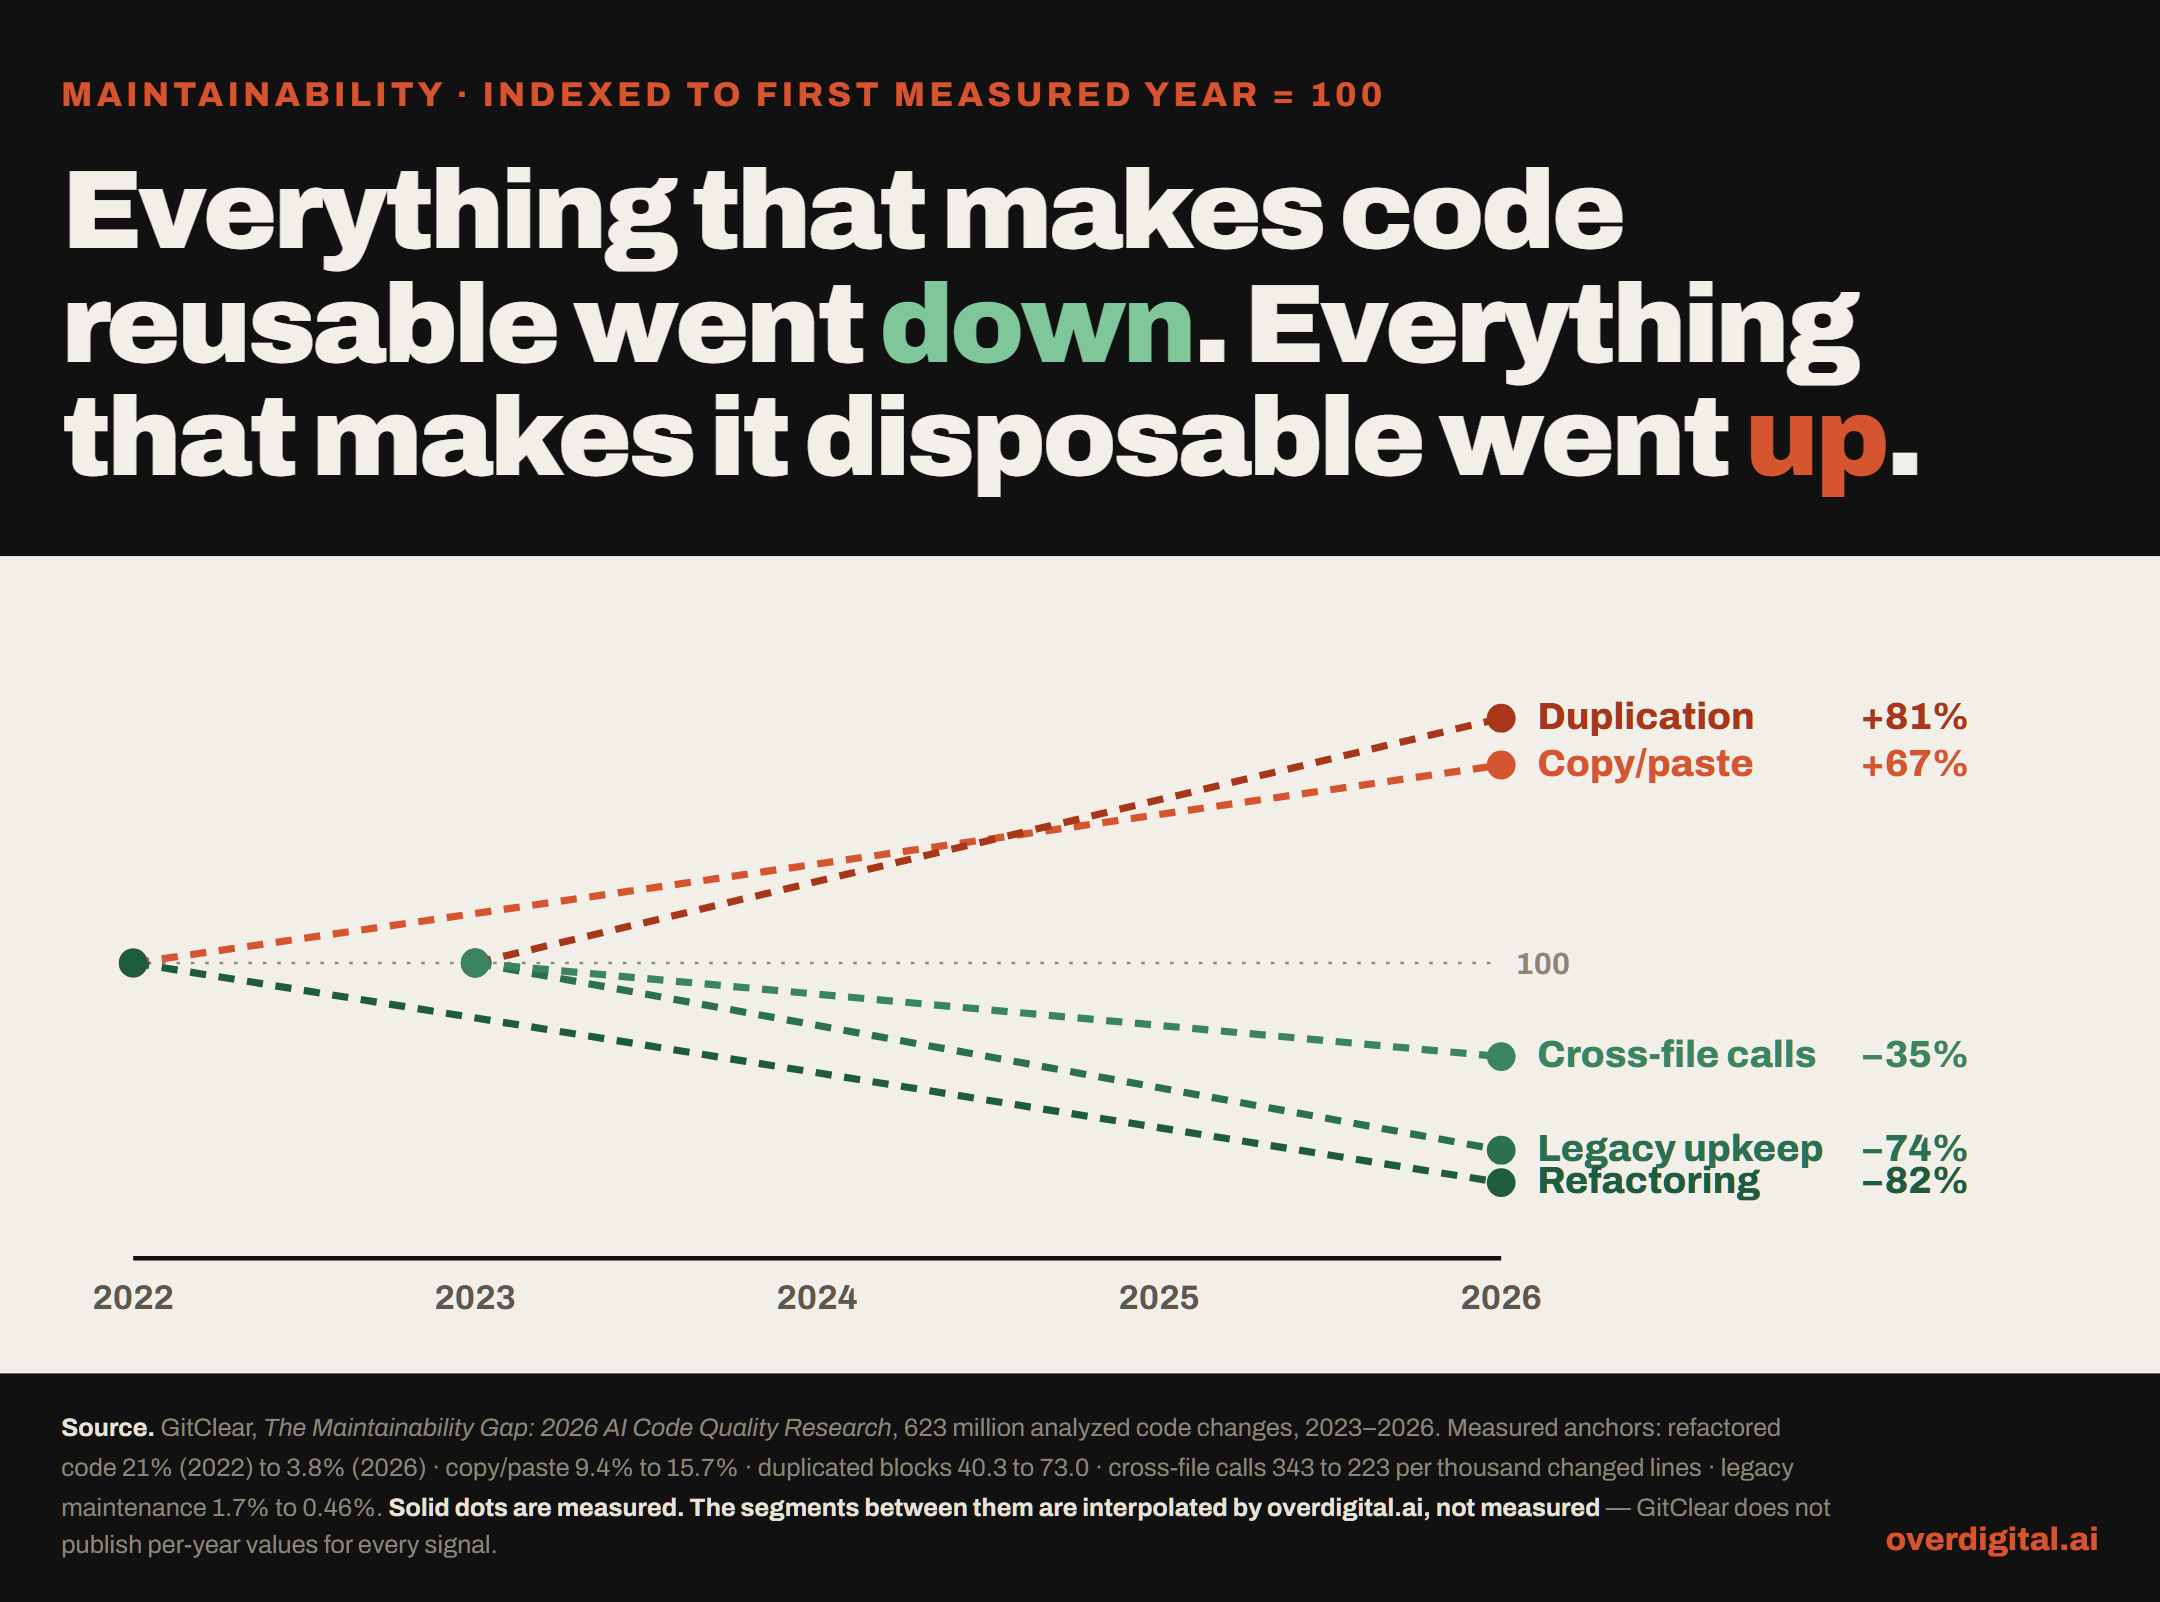
Taken together they describe less shared logic, less cleanup, and more paste. Churn, in GitClear's sense of code revised or reverted within two weeks of being written, is up 15 percent. Cross-file function connectivity dropped 35 percent, down from 343 to 223 calls per thousand changed lines. Shared logic is being reused less. These are shape-of-diff measurements though, not measurements of intent: they cannot tell you whether anyone looked for an existing helper. What they do show is that a local copy now wins over a shared one.
Legacy code maintenance plummeted 74 percent, dropping from 1.7 percent in 2023 to 0.46 percent so far in 2026. New features are winning that trade against maintenance of the code already written. Error-masking constructs - the try-catch blocks that swallow exceptions without fixing them - are up 47 percent. Developers are now roughly five times more likely to copy-paste code than to refactor it.
I build solo with agents. What I am building is a production platform for AI video series: scripting, character and world continuity, voice, generation across several third-party model providers, cost control, and publishing. Other people make their own shows on it. I run one of my own through it, which is how I find out what is broken. That is one data point and not an industry study, but the failure modes are instructive. When agents are doing the writing, the limiting factor is never how much code appears. The agents can generate pull requests all day, pulling in context, writing tests, dropping in new dependencies, and pushing branch after branch.
The work moved to the integration point, and then it split again. I do not read most diffs. A reviewing agent does that, and I work a level above it: the commits, what actually shipped, and the places where the reviewer and the test suite disagree. The time that used to go into writing now goes into deciding whether to believe a review I did not perform.
In a traditional organization, a junior engineer writes code. A senior engineer reviews it. That review leans on the junior carrying business context and knowing the unwritten rules of the domain.
Agents get context, but it is partial, lossy, and chosen for them. They write code that looks correct but fails structurally. The review burden skyrockets.
Accountability cannot be delegated to a language model. When the cost of generating a proposed solution drops to near zero, the scarce skill becomes judgment. It is the ability to look at a system, understand the blast radius of a change, verify its correctness, and reject the pull request when the abstraction is wrong.
This changes what a senior engineer does all day. They stop writing the core logic and start acting as a quality assurance gateway. You need fewer people typing out React components. You need more systems architects, you need more integration specialists, and you need engineers who understand how the entire system fits together, because the agents certainly do not.
You cannot fire an agent for taking down production. The person who merges the pull request owns the outage. That changes the risk profile of the job.
Raise merge volume without raising review capacity and more defects get through. For a long time there was no credible published figure for how much merge volume actually rises, and I was not going to invent one. That figure now exists.
Faros AI's AI Engineering Report 2026, published in April, is the largest dataset of its kind I have found: two years of telemetry from 22,000 developers across more than 4,000 teams, comparing each organization against itself between its lowest and highest periods of AI adoption. The throughput gains are real and they are large. Epics completed per developer up 66 percent, task throughput up 33.7 percent, pull request merge rate up 16.2 percent.
Then the rest of the ledger.
Faros sells engineering analytics, so read the framing with that in mind. The measurements are still the closest thing the industry has to a controlled comparison, because each organization is its own baseline rather than being scored against a peer group.
Pull requests merged with no review at all, human or agentic, are up 31.3 percent, and the incidents-to-PR ratio is up 242.7 percent. Those two belong together. Reviewers cannot keep pace with the volume arriving for their attention, so a growing share of changes stop being reviewed by anyone, and production absorbs the difference. No one set that as a policy. It is the residue of a queue nobody resized.
The reviewers who do keep pace pay for it differently. Increase the volume of pull requests without increasing review capacity and you get fatigue. Reviewers start skimming. They see green tests, read a coherent-sounding PR description, and click approve.
Engineering leadership has to redefine what a sprint looks like. You cannot measure velocity by lines of code or tickets closed if the tickets are closed by agents but the system falls over a week later. We need to measure review time, rollback rates, and system stability over time.
So I measured my own
I spent July building that system with agentic development, mostly a coding agent running subagents rather than the standing fleet that came later. It is a platform rather than a single app, so the things that break are rarely syntax. They are continuity across episodes, tenant isolation, spend that has to be capped before a render starts, and the seams between model providers that change under you. That is most of the engineering, and none of it is visible in the finished episode. Everything below is that one month: one repository, one person, the twenty-eight days of July 2026, counted from git log with generated files excluded and the window cut at midday on the 28th. It is a snapshot rather than a steady state, and a different month would read differently. I am reporting it because most of the writing on this subject has no numbers attached to it at all.
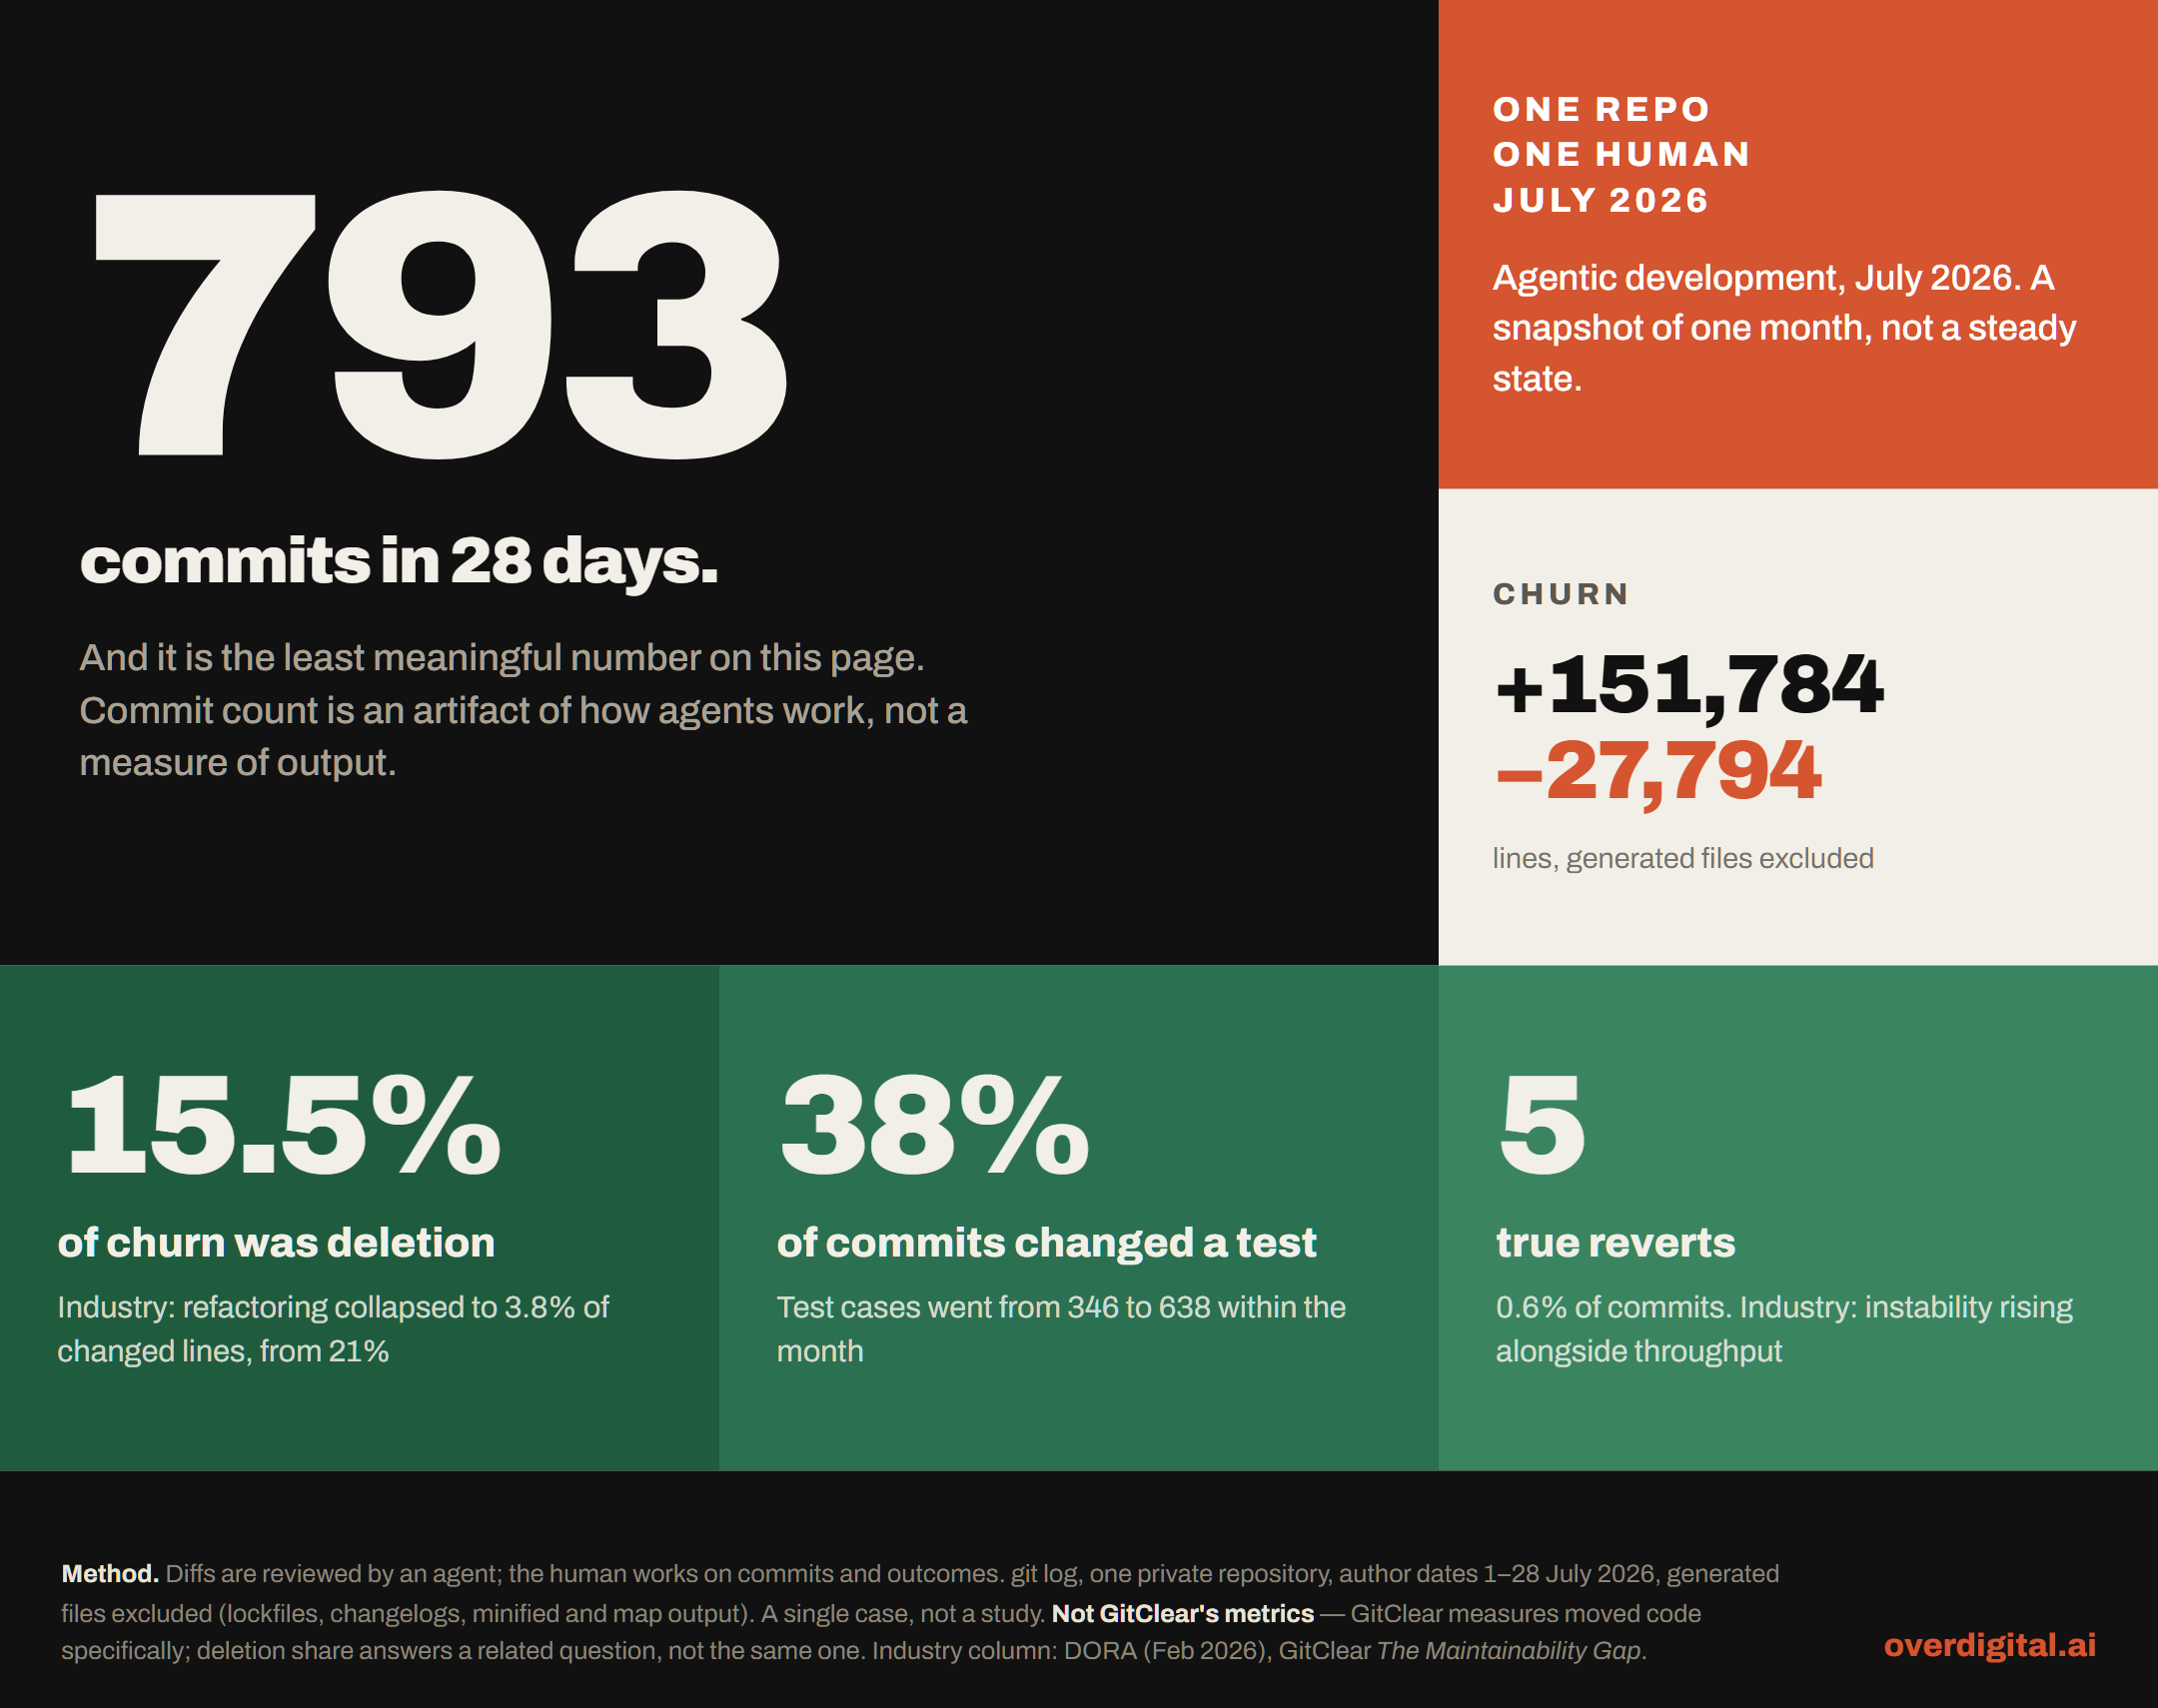
Start with the number to distrust. 793 commits in 28 days is not a productivity claim. It is an artifact of how agents work. They commit in small increments because that is what keeps them reviewable. Anyone quoting a figure like that as output is selling something.
The numbers worth watching are the ones the research says should be collapsing.
Is anything coming back out. Of the non-generated lines that changed, 15.5% were deletions. GitClear measures moved code specifically, and I cannot reproduce their metric without their tooling, so this is a different measurement of a related question: whether code ever leaves the system, or only enters it.
Is the work being verified. 304 of the 793 commits changed a test. Test cases went from 346 to 638 inside the month. Nothing merges without the suite passing, including the work I did not write, which is most of it.
Did the speed cost stability. Eleven commits in the month are titled Revert. Five of them I classify as true reverts. That classification is a judgment call, and mine rather than a tool's, so the number anyone can reproduce from the log is eleven and five is what is left after reading them. I am quoting both, because quoting only the smaller one is how this kind of number goes wrong.
Three of those are activity measures, and they are not the measures I just argued for. I asked for review time, rollback rates and stability, and I reported commits, tests and reverts, because those are what a git history gives you for free. Test count is not coverage quality. Five reverts is not a change-failure rate, it is flattered by a denominator of unusually small commits, and the classification is mine rather than a tool's. The honest version is that I measured the cheap proxies and still owe the expensive ones.
I do not read that as a story about personal discipline, and I would be suspicious of anyone who framed it that way. It is a story about org design with a sample size of one. There is one human in the loop, which is not the same as one reviewer. The gate is a stack: the test suite, a reviewing agent that reads the diffs, and me on the commits and the outcomes. What cannot be skipped is the last link in it.
That is the uncomfortable part of it. The gate held because the structure made it impossible to skip, not because anyone had good intentions about quality. It also means I own the outage for diffs I never read, which is the part of this I am least comfortable defending and the part I think every engineering organization is about to meet. Reproducing that with fifty engineers is an organizational design problem, and no tool in the stack solves it for you.
An organization built for this is designed around verification, and what that looks like on an org chart is narrower than the slogans suggest. Verification capacity becomes a staffing input rather than something senior engineers absorb between other work, which means the review queue gets an owner and a budget the way an on-call rotation does. Whatever agent capacity a team runs becomes infrastructure with an owner, a spend line, and known failure modes, because otherwise it lands on whoever noticed it last. That is as true for a team shipping a product as it is for one shipping episodes, and I happen to be building the platform underneath the second. And the promotion ladder needs a rung for integration judgment, or the people doing the scarce work keep getting measured on the abundant work.
None of that is a headcount cut. It is the same people pointed at the expensive step instead of the cheap one.
Agent-generated code does not change who owns production. The team that merges it does.
Whether anyone on that team read the diff is now an org design decision, not a given.
Discussion
Be the first to comment